data viz with ggplot
load packages
We can use the library() function to load the packages we need. The tidyverse package contains tons of useful functions for data wrangling and visualisation (including ggplot). The ozbabynames package contains data from birth records in Australia.
read the babynames data
ozbabynames <- ozbabynames

glimpse(ozbabynames)
Rows: 252,358
Columns: 5
$ name  <chr> "Charlotte", "Olivia", "Ava", "Amelia", "Mia", "Isla"…
$ sex   <chr> "Female", "Female", "Female", "Female", "Female", "Fe…
$ year  <int> 2017, 2017, 2017, 2017, 2017, 2017, 2017, 2017, 2017,…
$ count <int> 577, 550, 464, 442, 418, 392, 378, 353, 351, 339, 334…
$ state <chr> "New South Wales", "New South Wales", "New South Wale…
define the names you want to compare
btw Lady Gaga’s real name is Stefani
artist_names <- c("Billie", "Taylor", "Stefani")
whose name is most popular??
ozbabynames %>%
  filter(name %in% artist_names) %>%
  group_by(name, year) %>%
  summarise(count = sum(count)) %>%
  ggplot(aes(x = year,
             y = count,
             colour = name)) +
  geom_line() +
  theme_bw() +
 facet_wrap(~name,
            scales = "free_y") +
  theme(legend.position = "none")

What does the scales = "free y" do? What happens if you delete it? Is the plot more meaningful with “free y” or without it?
Changes the scale on the Y axis so that it varies for each plot depending on the frequency for each, e.g., for Stefani, the plot appears as almost a straight line when ‘free y’ is removed, but more clearly shows a peak around 1998 when ‘free y’ is added.
Recreate the plot above with your names
your_names <- c("Bonnie", "Siobhan")
What do you need to change about the code below to make it plot your names?
ozbabynames %>%
  filter(name %in% your_names) %>%
  group_by(name, year) %>%
  summarise(count = sum(count)) %>%
  ggplot(aes(x = year,
             y = count,
             colour = name)) +
  geom_line() +
  theme_bw() +
 facet_wrap(~name,
            scales = "free_y") +
  theme(legend.position = "none")
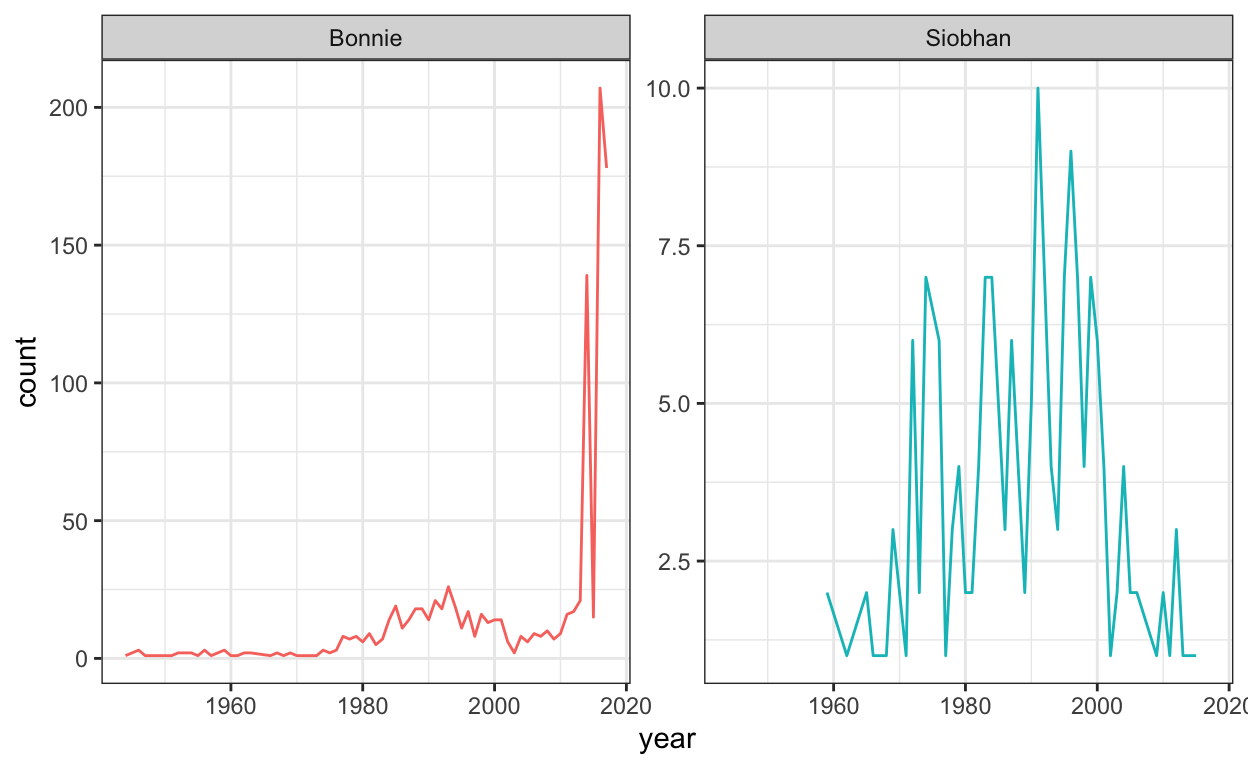
Do you need scales = "free_y"?
Maybe. Without it, the data for the name “Siobhan” appears as a somewhat flat, squiggly line, but it is easy to compare it to the name Bonnie when they are placed side by side.