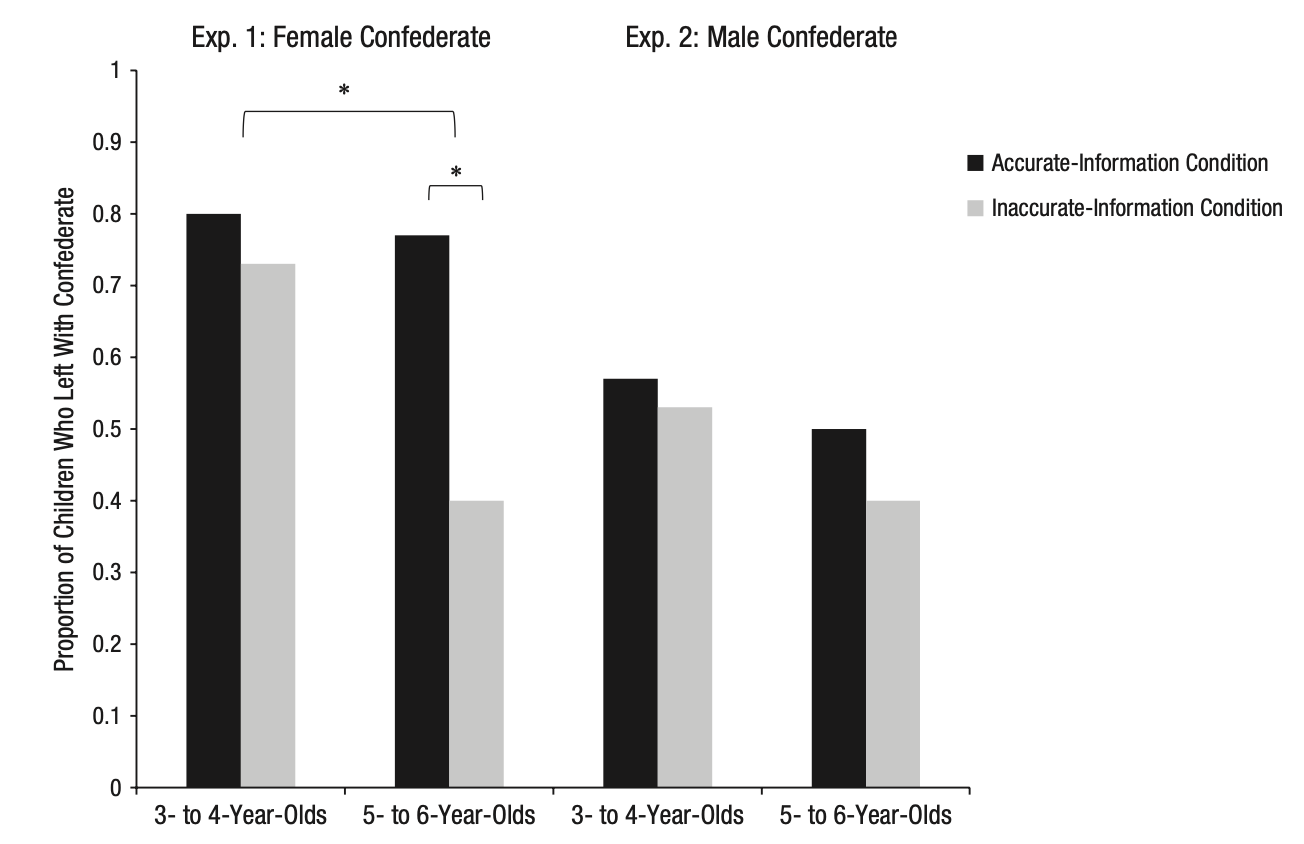
The goal is to reproduce the values and formatting of this graph.
read in data and clean the names
show names
[1] "id"                     "experiment"
[3] "age_group_participants" "condition_information"
[5] "gender_participants"    "age_participants"
[7] "response"               "hesitation_time"
[9] "notes"
convert response values to percentages (as per Table 3)
 experiment         0         1        NA_
          1 0.3145161 0.6532258 0.03225806
          2 0.4692308 0.4692308 0.06153846
mutate dataset to add new variable “agegroup” with two possible values representing the two age groups
trust <- trust %>%
  mutate(agegroup = case_when(age_group_participants == 0 ~ "3-5 year olds",
                              age_group_participants == 1 ~ "5-6 year olds"),
         condition = case_when(condition_information == 0 ~ "Inaccurate-Information Condition",
                               condition_information == 1 ~ "Accurate-Information Condition"))
creating the graph using ggplot
trust %>%
  ggplot(aes(x = agegroup, y = response, fill = condition)) +
  geom_bar(position = "dodge", stat = "identity") +
  theme_bw()